Two horsepower figures on the same printout can look like a contradiction. So can a claimed gain that barely changes how the car feels. Often, the figures describe different things, or the change appears in a part of the rev range you seldom use.
A dyno sheet records power and torque curves under specific test conditions. It is a record of that measurement, not a context-free verdict on the engine or the vehicle. Before judging a peak or comparing two sheets, identify where output was measured, what each line represents, and whether the tests were run on comparable terms.
- First, identify what the dyno sheet actually measures
- Follow the horsepower and torque curves across engine speed
- Judge the usable rev range, not just the headline peak
- Wheel, crank, corrected and uncorrected power: which number is which?
- Why two horsepower figures can both be accurate
- Compare runs without mistaking variation for a gain
- Why a strong dyno curve may feel different on the road
- Red flags before you trust or share a dyno sheet
- Frequently asked questions
- How do you calibrate a dyno?
- What does smoothing do to a dyno curve?
- How to read a dyno sheet?
- How to read a dynamometer?
First, identify what the dyno sheet actually measures
Start with the test identity. A chassis dynamometer, or chassis dyno, measures output at the driven wheels while the vehicle runs on rollers or another load device. An engine dyno measures output at the engine. Wheel and crank figures are different measurements, so a manufacturer’s engine-output claim should not be read as the target for a chassis-dyno printout.
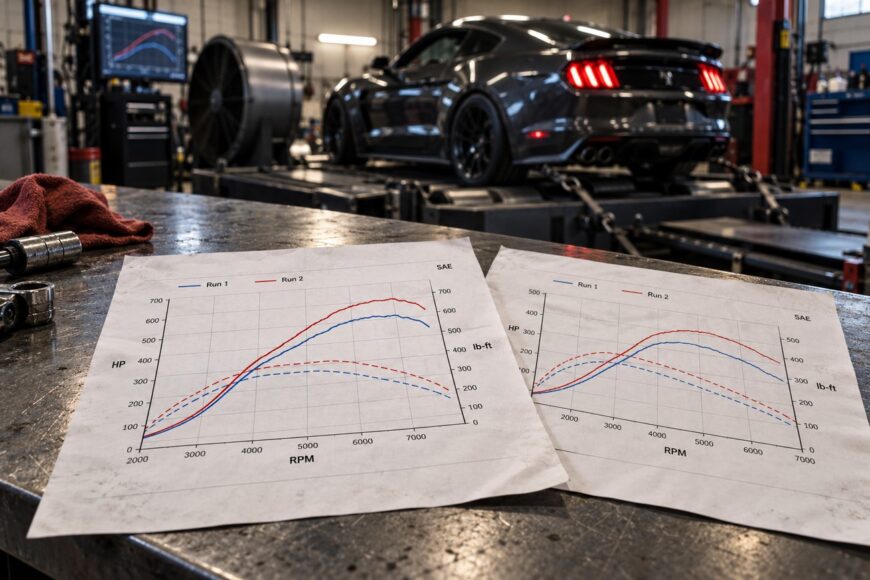
Next, find the run labels, test mode, and any notes about gear or conditions. On the graph, identify the horizontal and vertical axes, their units, and the legend that assigns a line to each run or measurement. Layouts vary: a label near a peak may name horsepower, while another line and scale represent torque.
Read the tick marks before estimating a value between them. The value of each division depends on the difference between labeled marks and the number of divisions separating those marks; a tall-looking gap on the page may represent a small numerical change. Check whether the displayed engine-speed range has been cropped, too, since that can hide what happened before or after the highlighted peak.
Overlaid horsepower and torque lines may use separate left and right vertical axes, with different units and scales. Their plotted heights therefore cannot be compared directly. Trace each line back to its legend and axis before deciding what a crossing, gap, or apparent rise means.
Follow the horsepower and torque curves across engine speed
The horizontal axis usually shows engine speed in revolutions per minute (rpm). At each point along it, the torque curve shows the twisting moment produced at that speed, and the horsepower curve shows the rate of doing work. Horsepower depends on both torque and engine speed, which is why the two curves need not reach their peaks at the same rpm.
To read output at a particular speed, locate that rpm on the horizontal axis and move vertically to the line you want. Then read across to the vertical scale assigned to that line. If several runs are overlaid, use the legend to keep them separate rather than taking the highest trace at each point as though it were one continuous run.
Follow a curve from the start of the measured range to the end. A sustained rise or broad plateau describes a different result from a sharp peak that immediately falls away. Look for dips as well: a brief drop in the middle of an otherwise strong trace can matter more in use than a slightly higher maximum near the end.
A crossing between horsepower and torque lines is especially easy to overinterpret. Its position on the page depends on the chosen units and vertical scales, which may differ between the left and right axes. Read the numerical values at a given rpm instead of treating the crossing itself as a performance milestone.
Judge the usable rev range, not just the headline peak
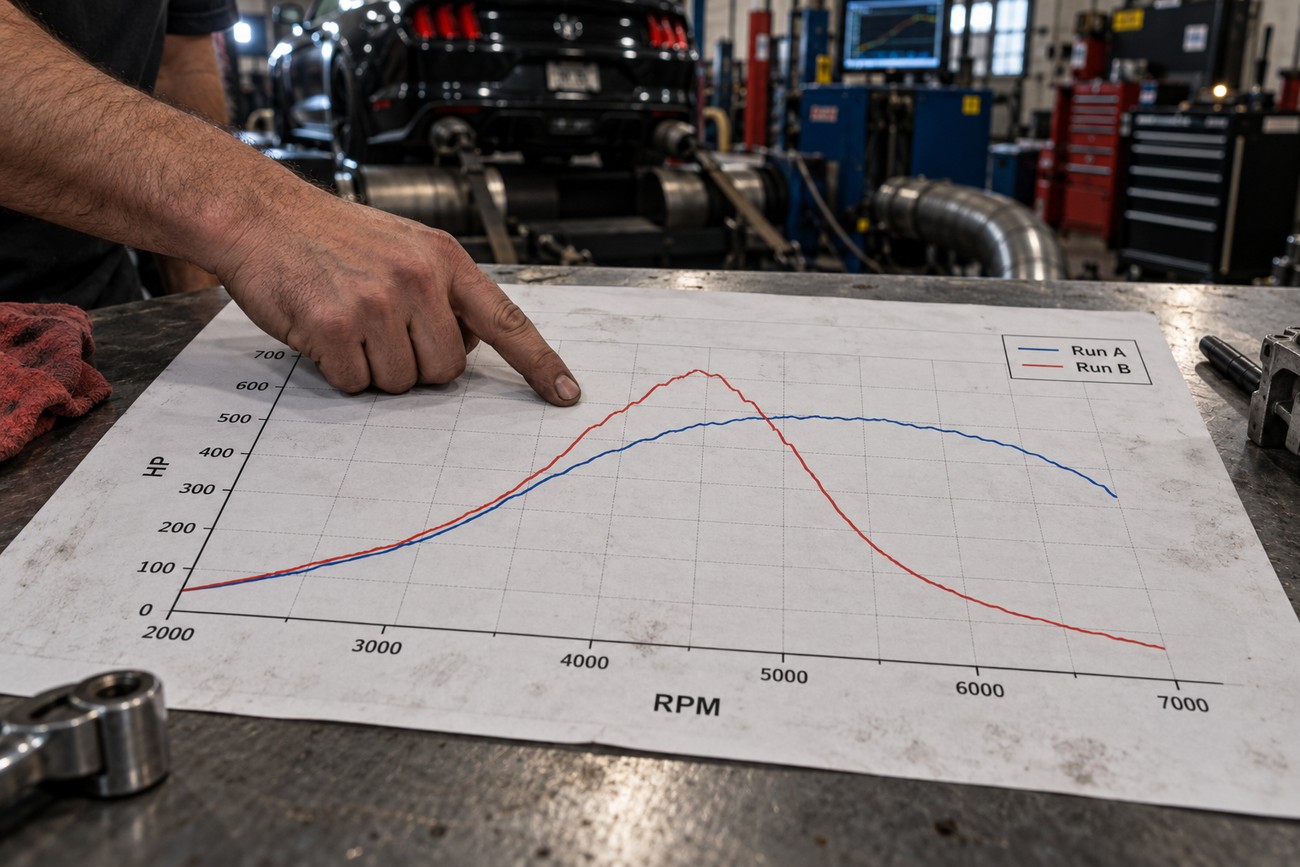
Peak horsepower and peak torque are useful labels, but each identifies only one point on a curve. A high peak confined to a narrow band can leave less output elsewhere than a lower peak supported over a broader range. An early falloff or a midrange dip may be invisible in an advertisement built around the maximum figure.
Focus on the engine speeds reached during the driving you care about. If acceleration keeps the engine in the middle of the plotted range, a change at the far upper end may have little effect on that particular maneuver. If the vehicle is routinely held near the top of its range, that upper section deserves more attention.
A broad, accessible band of output can make a vehicle easier to keep in its useful range, though a flat torque curve is not automatically preferable for every use. Gearing determines how quickly the engine moves through each part of the graph and where it lands after a shift. The relevant band is therefore a feature of the vehicle and the intended driving, rather than a fixed rpm window that suits every dyno sheet.
Compare the shape before celebrating a larger number. A modification might lift the peak while leaving a dip where the engine spends much of its time; another might improve that region without changing the headline figure much. Neither peak alone establishes which vehicle will perform better.
Wheel, crank, corrected and uncorrected power: which number is which?
These labels answer two separate questions: where output was measured and how test conditions were treated in the reported result.
| Label | What it represents | Where you may see it | Comparison mistake to avoid |
|---|---|---|---|
| Wheel output | Output measured at the driven wheels. | A chassis-dyno result. | Comparing it directly with a crank-output claim. |
| Crank output | Output measured at the engine. | An engine-dyno result or manufacturer claim. | Treating it as though a chassis dyno measured it at the wheels. |
| Corrected result | A reported result adjusted under a stated correction method to account for test conditions. | A sheet marked with a correction setting or standard. | Comparing it with a result using another setting without checking the methods. |
| Uncorrected result | A result reported without that atmospheric correction. | A sheet labeled uncorrected, or one showing both versions. | Assuming it was reported on the same basis as a corrected figure. |
A sheet can report wheel output and be either corrected or uncorrected. Correction changes how test conditions are treated; it does not convert wheel output into crank output. If a printout lists two power figures, check both their measurement location and their correction labels before trying to reconcile them.
A calculated crank estimate on a chassis-dyno sheet is also different from an engine-dyno measurement. Its usefulness depends on the calculation and assumptions stated by the facility. There is no universal drivetrain-loss percentage that makes wheel and crank numbers interchangeable across vehicles and tests.
Why two horsepower figures can both be accurate
A manufacturer’s claim and a chassis-dyno reading often begin at different measurement locations. The former may describe crank output, while the latter reports power at the driven wheels. A lower wheel figure does not, on its own, disprove the engine claim; the numbers answer different questions.
Even two chassis-dyno sheets need context. Dynos can differ in measurement method and calibration, and operators may select different gears or test modes. Ambient temperature, pressure, and humidity can also affect a run. A sheet with a correction label adds another decision to check: which method was applied, and was the other figure reported on the same basis?
Some differences are therefore legitimate without either printout being “wrong.” That does not make every discrepancy explainable from the pages alone. If the test mode, gear, correction setting, or conditions are missing, ask for the complete run record rather than choosing the figure that best matches expectations.
Resist attempts to settle the mismatch with a fixed conversion between dynos or from crank to wheel power. Such a shortcut conceals the very differences you need to examine. For a change to one vehicle, comparable runs on the same setup usually tell you more than a comparison with a separate headline claim.
Compare runs without mistaking variation for a gain
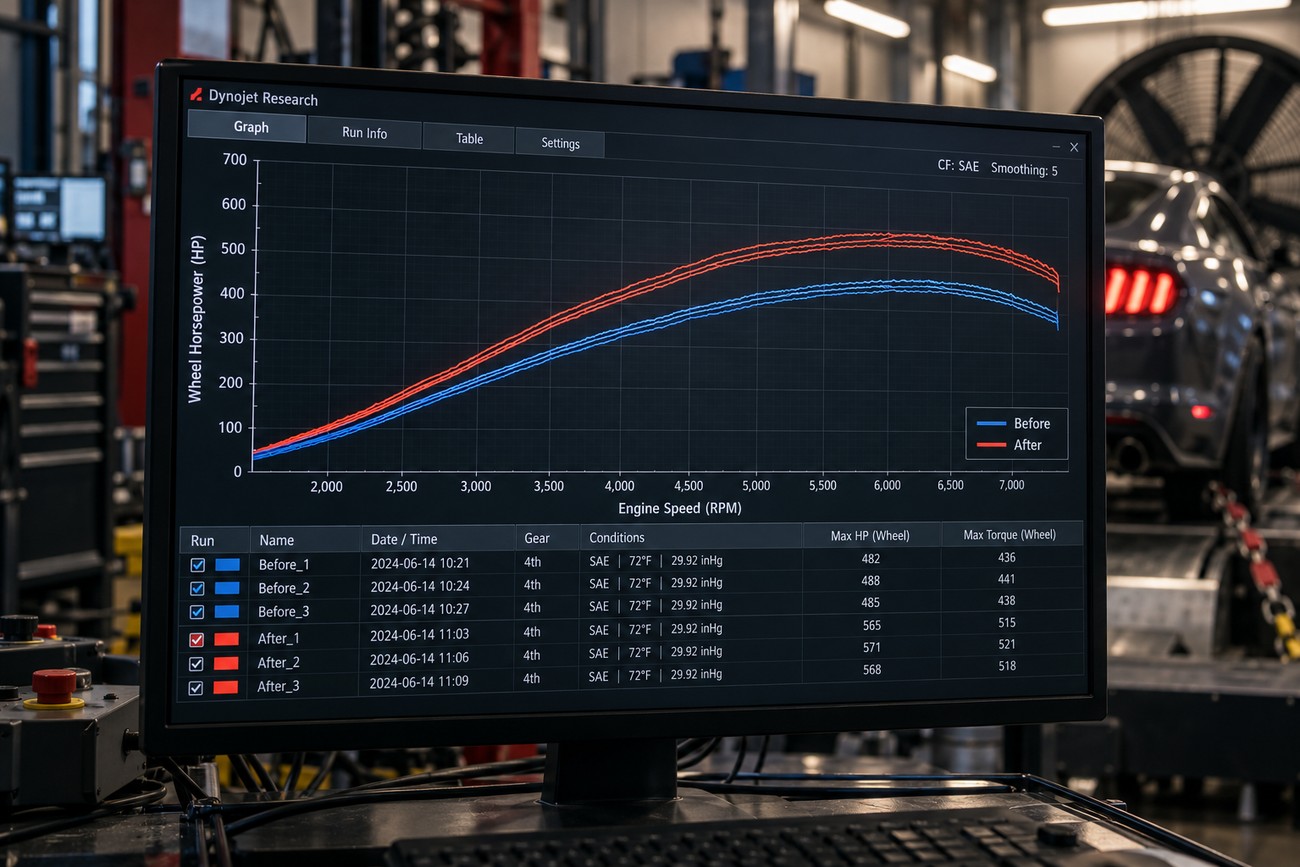
For a before-and-after test, first match the basics: the same dyno, measurement mode, selected gear, and correction setting. Check that temperature, pressure, humidity, and the vehicle’s operating conditions were broadly comparable. If an item changed, record it rather than treating the two sheets as a controlled comparison.
Next, overlay the runs and inspect the same rpm range on the same scales. A change that persists through the useful band is more informative than a single higher peak. Watch for a gain in one region paired with a loss in another, and make sure a cropped graph has not removed either part of the story.
A “best before” versus “best after” comparison can hide the spread between pulls. Ask to see the comparable repeat runs from both sessions, including traces that did not produce the headline peak.
Repeated pulls show variation that a single run cannot reveal. If the before and after traces overlap substantially, a small apparent increase may reflect test or measurement variation rather than a demonstrated gain. There is no universal error margin or minimum gain that resolves every case; the observed spread, consistency of the change, and test conditions provide the evidence.
Why a strong dyno curve may feel different on the road
A dyno trace maps output against engine speed; a driver experiences how the vehicle moves through those speeds. Gear ratios influence the engine-speed range used during acceleration and where the engine lands after a shift. A gain that sits outside that range may be clear on paper yet hard to notice in the intended driving.
High engine torque alone does not establish strong acceleration. Gearing affects the torque delivered at the wheels, while vehicle load and traction affect what that delivery can accomplish. Two vehicles with similar peak figures can consequently respond differently, even before their drivers use different gears or throttle inputs.
Road conditions also differ from a controlled dyno pull. Airflow, temperature, available grip, and how long the vehicle is under load can change the conditions in which the engine operates. A sheet is valuable for examining measured output across rpm, but it does not capture every condition behind the way a car accelerates or feels.
Use a road impression to define which part of the curve deserves investigation, rather than asking the peak to explain the entire impression. If a vehicle feels weak after an upshift, look at the rpm where it lands and the output available there. The graph may clarify that behavior without serving as a complete prediction of road performance.
Red flags before you trust or share a dyno sheet
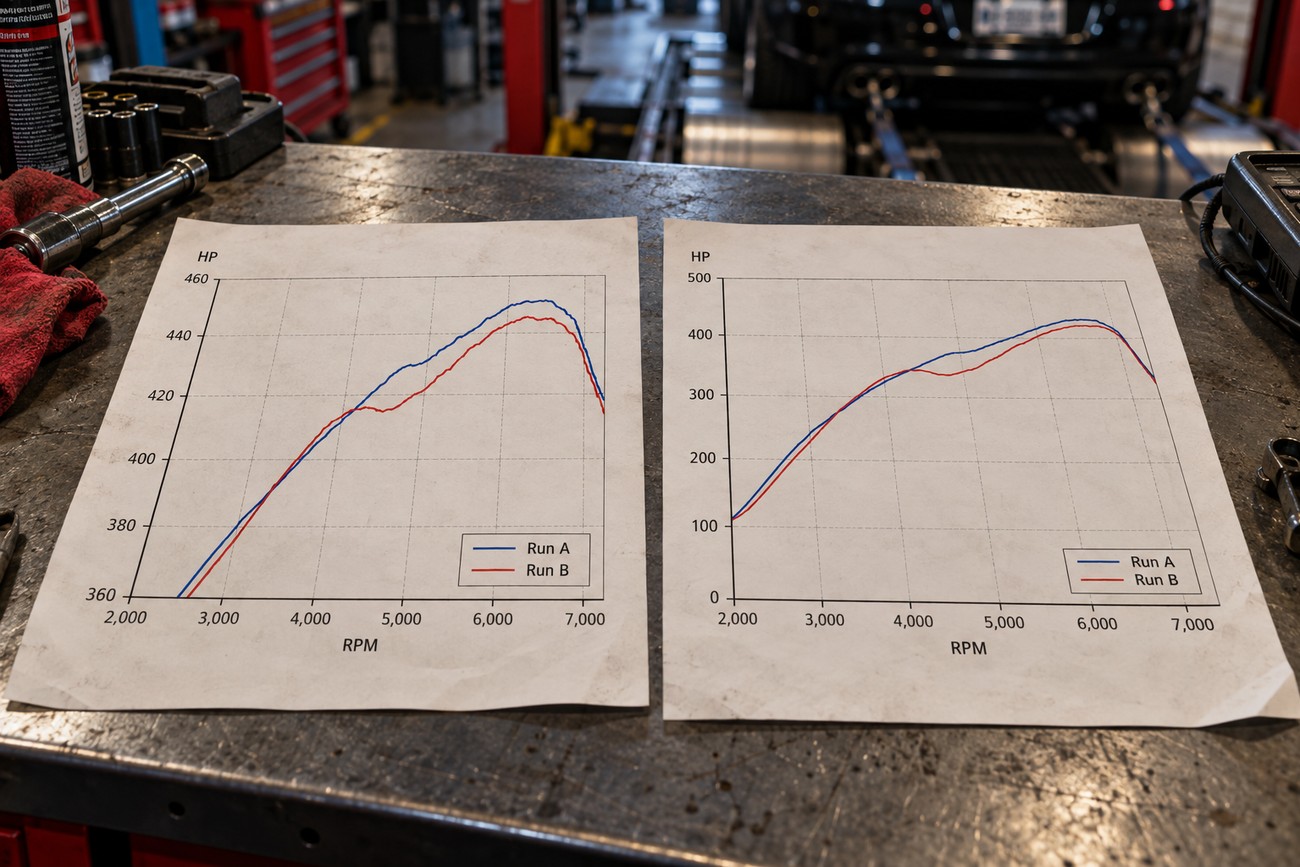
Check first for labeled axes, units, a legend, and an identifiable run. Without them, even a clearly drawn line can be assigned the wrong value or mistaken for a different measurement. On a dual-axis plot, confirm which vertical scale belongs to each curve; the apparent gap between lines has no reliable meaning until you do.
Inspect the presentation as carefully as the peak label. A restricted rpm range can conceal a dip or early decline, while tight vertical scaling can make a small change look dramatic. Smoothing, which reduces visible jaggedness in a plotted trace, may also make a brief feature less obvious. None of these choices proves deception, but each limits what a screenshot can support.
Missing correction settings, gear, test mode, or ambient conditions make cross-sheet comparisons harder to defend. A claimed gain backed by one attractive trace is weaker still, because it provides no view of run-to-run spread. Request the complete labeled sheets, relevant test details, and repeat-run overlays before relying on the claim or sharing it as a verified result.
An incomplete image may simply be a cropped copy of a fuller record. Until that record is available, keep the conclusion narrow: identify the measurement, read the whole curve, and confirm that the comparison is repeatable. A larger peak by itself does not establish a better-performing vehicle.
Frequently asked questions
These questions cover common issues in interpreting dyno sheets, including calibration, smoothing, and reading the reported curves. The same principles apply throughout: check the labels, test conditions, and measurement basis before drawing a conclusion.
How do you calibrate a dyno?
Calibration or verification is an operator procedure for checking the dyno against its specified references and maintenance process; it cannot be performed by reading a customer’s sheet. The steps depend on the equipment and its manufacturer’s instructions. You can ask the facility when its checks were last documented, what those checks covered, and whether any issue was found before your runs. A printout alone does not establish calibration status.
What does smoothing do to a dyno curve?
Smoothing is display processing that reduces visible jaggedness in a plotted trace. It can make the overall trend easier to read, but a higher smoothing setting may obscure a brief dip or spike without creating a new measurement. For a close comparison, request traces displayed with the same setting and inspect repeat runs; a smooth line cannot demonstrate repeatability.
How to read a dyno sheet?
Begin with the labels that tell you what test produced the sheet, then read a value by choosing an rpm, following the correct curve, and using that curve’s assigned vertical scale. If you need to report a result, name the measurement location and correction setting alongside the number. That keeps a wheel-power reading or an uncorrected run from being quoted as a different result.
How to read a dynamometer?
A dynamometer is the testing equipment; the sheet or on-screen graph is its reported output. During a test, follow the operator’s instructions rather than interpreting a live peak as the final result. Once the run is complete, use the recorded labels and curves, and ask the operator which mode and settings produced them. A changing live display offers less context than the saved run record.