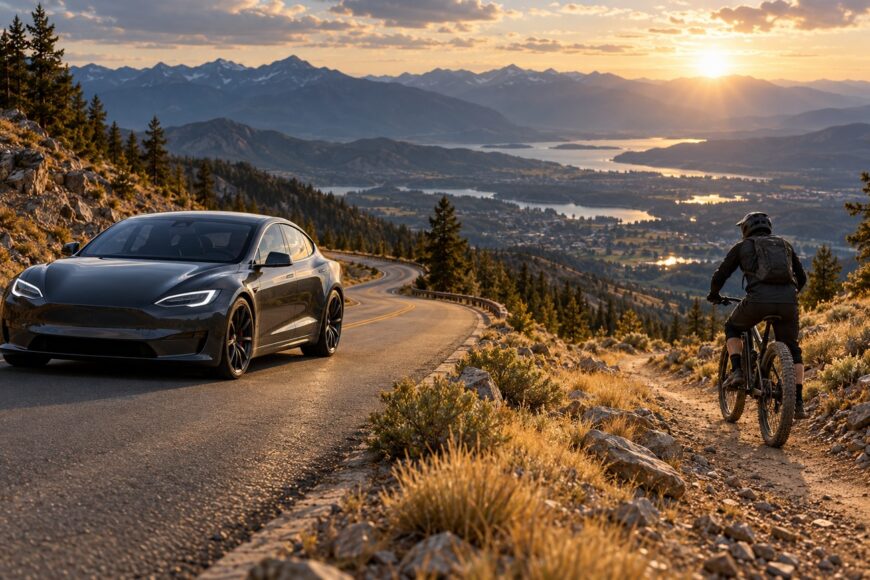
A 1,020-hp electric sedan can launch with brutal force, while a downhill mountain biker threads a narrow, technical descent through rocks, turns, and changing grip. Their strengths belong to different parts of the course: the Tesla has power and stability on open pavement, while the rider has line choice and a much smaller footprint.
The real contest is shaped by course design, braking, visibility, and stopping space. There is no comparable controlled test of a Tesla Model S Plaid against a specific downhill rider, so a universal winner would be invented rather than measured. The meaningful comparison separates finish time from the time required to slow to a safe, complete stop.
- The Race Cannot Be Answered by Horsepower Alone
- What the Plaid and the Downhill Bike Bring to the Descent
- Tesla Plaid vs. Downhill Bike: The Numbers That Actually Matter
- Why Corners and Braking Can Flip the Result
- The 200-Mph and Regenerative-Braking Myths
- How to Stage the Comparison Without Creating a Crash
- So Who Gets Down First?
- Frequently asked questions
- What can beat a Tesla Model S Plaid in a downhill race?
- How many g’s do you pull in a Tesla Model S Plaid?
- Why is a downhill bike allowed to use a different line from the car?
The Race Cannot Be Answered by Horsepower Alone
A downhill result changes with course length, gradient, surface, corner density, and the rider’s starting position. A wide, dry descent with long straights gives the Plaid room to deploy its acceleration. A narrow trail with tight turns, roots, rocks, and abrupt line changes gives the bicycle advantages that horsepower cannot replace.
The start also needs careful definition. A standing car launch and a rider already moving from the top of a trail are different contests, even if both begin at the same marker. The Plaid’s acceleration figure describes a specific test from rest; it does not automatically describe its advantage against a cyclist carrying momentum into the first corner.
Finish location matters just as much. If the result stops at the finish line, the car may record the earlier crossing while still carrying substantial speed. If the result includes a safe full stop, the required braking distance becomes part of the race rather than an afterthought.
A fair comparison would publish separate times for reaching the finish and coming to a complete stop. It would also record the surface, weather, tire condition, battery state, starting method, and course layout. Without those controls, “who gets down first?” has several valid answers.
What the Plaid and the Downhill Bike Bring to the Descent
The Model S Plaid uses three electric motors and has an advertised output of about 1,020 hp. Car and Driver recorded 0–60 mph in 2.1 seconds, illustrating how quickly the sedan can build speed on a suitable surface. Its low center of mass helps keep the body composed on consistent pavement, especially through broad, predictable bends.
That advantage comes with physical limits. The Plaid is wide, heavy, and designed as a road car, so it needs usable lane width, predictable radii, and a surface that supports four tires. It cannot reproduce a mountain-bike line through a narrow gap, over a jump, or around an obstacle that requires rapid wheel placement.
A downhill bike occupies little space and has a short wheelbase, allowing the rider to choose lines between obstacles. Body movement, braking position, and small changes in wheel placement help the rider preserve momentum through technical sections. The same agility also exposes the rider to greater physical risk when grip disappears or a line closes.
Neither competitor can use every possible trajectory. The car benefits from a clean, open route, while the rider can exploit narrow corridors that the sedan cannot enter safely. That difference in usable course area is often more important than the raw power gap.
Tesla Plaid vs. Downhill Bike: The Numbers That Actually Matter
The figures below separate tested results, advertised specifications, and course requirements. They describe capabilities and constraints rather than a head-to-head race result.
| Factor | Tesla Model S Plaid | Downhill bike | Why it matters |
|---|---|---|---|
| Launch | 0–60 mph in 2.1 seconds in a Car and Driver test | Depends on starting speed, rider technique, and surface | The Plaid gains quickly from rest on wide, usable pavement. |
| Braking from 70 mph | 148 feet in a Car and Driver test | Varies with rider, brakes, tires, gradient, and grip | Available stopping space can decide whether a finish is usable. |
| Braking from 100 mph | 297 feet, approximately 90.5 m, in a Car and Driver test | A downhill bicycle normally operates at different speeds and conditions | A single braking measurement does not predict repeated trail braking. |
| Top-speed claim | Approximately 162–163 mph (261–262 km/h) for the standard Plaid | Course and visibility usually limit practical speed | Maximum speed is rarely the controlling variable on a technical descent. |
| Approximately 200-mph capability | Available only with the separate Track Package and associated hardware changes, including upgraded wheels, tires, and brakes | Not a meaningful target for a technical MTB course | Advertised peak speed should not be confused with standard-car capability. |
| Mechanical braking | Ventilated discs measuring 395 mm front and 365 mm rear | Dedicated bicycle disc brakes, with performance dependent on setup and heat | Repeated downhill deceleration creates a different thermal challenge from one test stop. |
| Maneuverability | Requires sufficient width, radius, and predictable surface | Can select lines between obstacles and through narrow gaps | Technical terrain increases the value of the bicycle’s small footprint. |
| Stopping requirement | Needs a protected area that accommodates vehicle speed and mass | UCI downhill courses require a post-finish braking zone of at least 35–50 m, with protection and restricted spectator access | The finish must include space for controlled deceleration. |
The Plaid’s 2.1-second figure is a Car and Driver test result, while about 1,020 hp is an advertised power figure. The distinction matters because battery charge, temperature, tires, version, and installed equipment can affect repeatability. Neither number predicts how the car will behave after several hard downhill braking events.
The braking figures are also test results, not promises for every road. Car and Driver measured 148 feet from 70 mph and 297 feet, approximately 90.5 m, from 100 mph. Those distances show the space a fast, heavy vehicle can need under a particular test setup; they do not convert directly into a bicycle-versus-car finishing time.
The standard Plaid is generally limited to about 162–163 mph, while around 200 mph is available only with the separate Track Package and associated hardware changes, including upgraded wheels, tires, and brakes. That distinction is important for any comparison built around headline speed.
The UCI braking-zone requirement gives the comparison a useful safety reference: at least 35–50 m after the finish, with protection and restricted spectator access. A result that ignores this space rewards crossing the line quickly while leaving the most consequential part of the descent unmeasured.
Why Corners and Braking Can Flip the Result
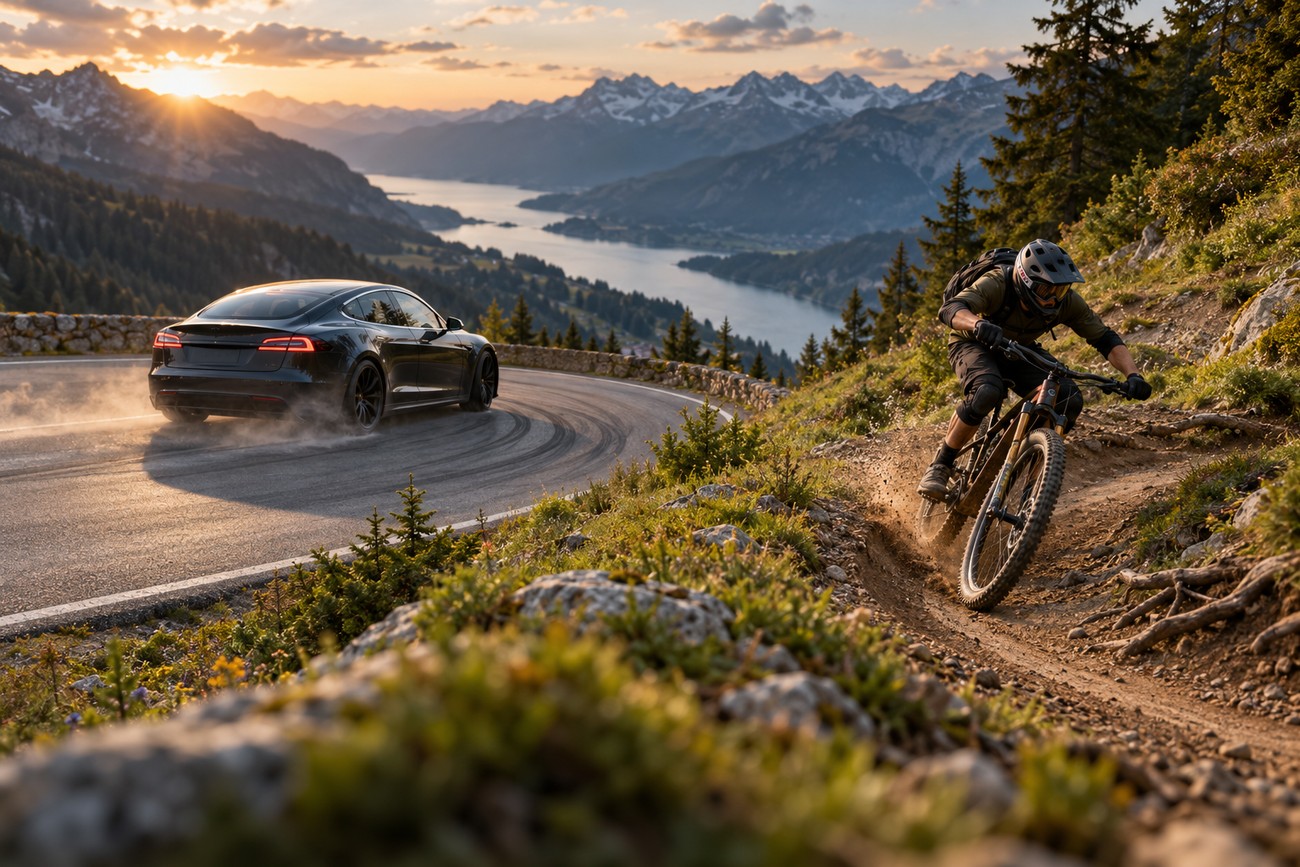
The decisive speed in a linked corner section is often the slowest corner, not the highest speed reached on the preceding straight. A car that carries too much speed into a hairpin must shed more energy and may need the entire road to rotate safely. A rider can lose less momentum by placing the wheels precisely and using a tighter line.
Long straights change the balance. The Plaid can accelerate hard once the surface is wide, dry, and predictable, then use its low center of mass and four-tire grip through broad bends. As the straights shorten and corners arrive in quick succession, the cost of width, mass, and repeated braking rises.
Downhill testing is often governed by the slowest corner in a linked section and by brake-temperature checks between runs, rather than by a single peak-speed number.
Mass affects every deceleration. A heavier car must dissipate more energy each time it slows, and a long descent can make repeated brake events more important than one impressive acceleration measurement. Heat, tire grip, and the driver’s ability to see the next corner become limiting factors before the powertrain reaches its headline capability.
The rider faces a different set of limits. Brake overheating, loss of tire grip, and arm fatigue can reduce control over a long descent, especially when the trail demands constant correction. A skilled rider may preserve speed through obstacles, yet fatigue can make the final section slower and less predictable.
The 200-Mph and Regenerative-Braking Myths
Approximately 200 mph is not the normal capability of a standard Plaid. The standard Plaid is generally limited to about 162–163 mph, while the higher claim requires the separate Track Package and associated hardware changes, including upgraded wheels, tires, and brakes.
That hardware distinction matters because top speed is a systems problem. Tires, wheels, brakes, battery condition, temperature, and software settings all influence whether a vehicle can safely deliver a claimed result. A headline number from a specially equipped car should not be applied automatically to every Plaid.
Tesla documentation identifies ABS, electronic brake-force distribution, stability control, and regenerative braking. The Plaid also uses separate hydraulic disc brakes, with ventilated discs measuring 395 mm front and 365 mm rear.
Regeneration can support deceleration and recover some energy, but it does not replace the mechanical braking system. Real-world performance varies with version, tires, temperature, battery charge, and installed equipment, so a downhill comparison should treat regeneration as one part of the braking strategy rather than a complete solution.
How to Stage the Comparison Without Creating a Crash
A responsible test requires a closed course and an independent risk assessment. The car and rider should make separate runs, eliminating the possibility that a vehicle error reaches a person on the trail. A rider is physically vulnerable to even a small mistake involving the car.
The course must be checked for width, turn radii, surface changes, visibility, and evacuation access. An MTB trail is not automatically suitable for a sedan: jumps, narrow corridors, loose material, uneven edges, and obstacle-avoidance lines may be manageable on a bicycle and unsafe for a road car.
The braking zone belongs in the original test design. It needs protection, restricted spectator access, sufficient length, and a surface that allows predictable deceleration. The start should also be standardized, with the same definition of standing start or rolling start for each run.
Separate timing should record the finish crossing and the full-stop point. If conditions change, runs should be repeated or clearly excluded rather than combined into a misleading average. A clean comparison teaches more when it exposes its limits than when it creates a dramatic but unsafe result.
So Who Gets Down First?
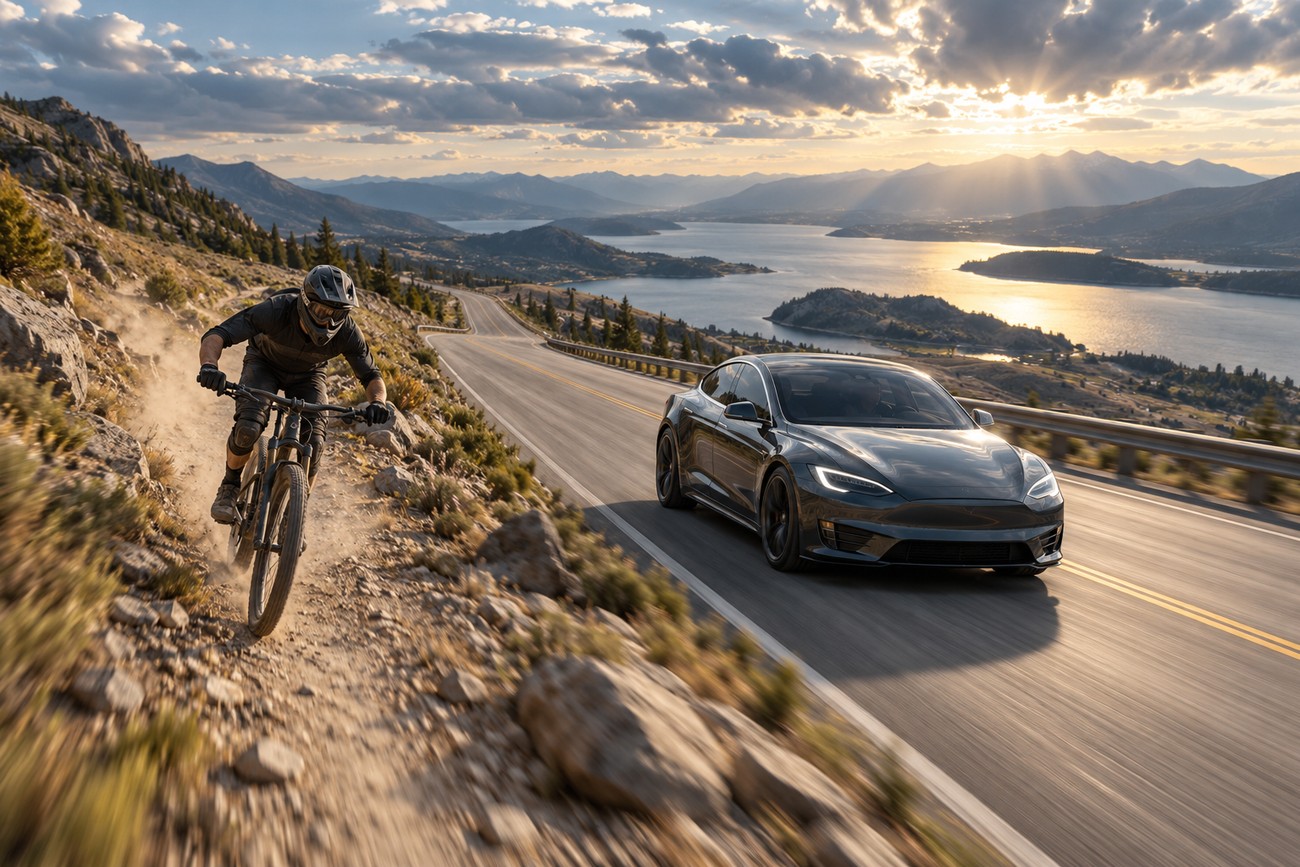
On a broad, dry, fast descent with long straights, the Plaid is the likely winner. Its three electric motors, immediate launch response, and four-tire contact patch give it a substantial acceleration advantage wherever the road provides enough width and grip.
A skilled downhill rider may gain the advantage on a narrow, technical MTB course. Tight hairpins, frequent obstacles, and limited usable width increase the value of bicycle maneuverability, while the sedan must slow more, occupy more space, and avoid lines designed around a bicycle’s dimensions.
The answer also changes with the finish definition. A car may cross the line first yet need significant distance to stop, while the bicycle may reach a safe stopped position sooner on a technical course. The fairest result therefore reports both finish time and full-stop time.
Horsepower describes only one part of the descent. Course layout, gradient, surface, start method, tire and battery condition, visibility, and braking space determine which competitor can turn speed into a safe result.
Frequently asked questions
What can beat a Tesla Model S Plaid in a downhill race?
The answer depends on the discipline being rewarded. Another high-performance vehicle may challenge the Plaid on acceleration or a fast paved course, while a skilled downhill rider can exploit technical terrain that the sedan cannot physically use.
The useful comparison is therefore between course demands rather than vehicle labels. Long straights favor the Plaid; narrow lines, tight turns, and obstacle-dense terrain can favor the bicycle.
How many g’s do you pull in a Tesla Model S Plaid?
No single g-force number can be responsibly assigned from the available information. Launch load varies with surface, battery charge, tires, temperature, the measurement point, and the test method.
A recorded acceleration time describes one test condition rather than every launch. It also does not describe the forces produced during repeated downhill braking, which depend on speed, gradient, grip, and brake temperature.
Why is a downhill bike allowed to use a different line from the car?
Line choice is a core part of the competition because the two vehicles have different dimensions and contact points. A rider can place each wheel around an obstacle, clear a narrow gap, and move the body to keep the bike balanced where a sedan would need more width.
That difference changes the usable course itself. A fair comparison can allow each competitor to use a safe line suited to its design, provided the route, start, finish, timing, and safety controls remain consistent.